Batch Processing Benchmarks
Batch benchmarks measure complete directory processing: parsing, SASA calculation, output writing, and worker scheduling. The current benchmark results use zsasa v0.6.0, pinned comparator builds, 128 sphere points, and 10 threads unless noted.
TL;DR
FreeSASA has no native directory-batch command, so the FreeSASA batch rows use a thin freesasa_batch wrapper around the pinned FreeSASA C API.
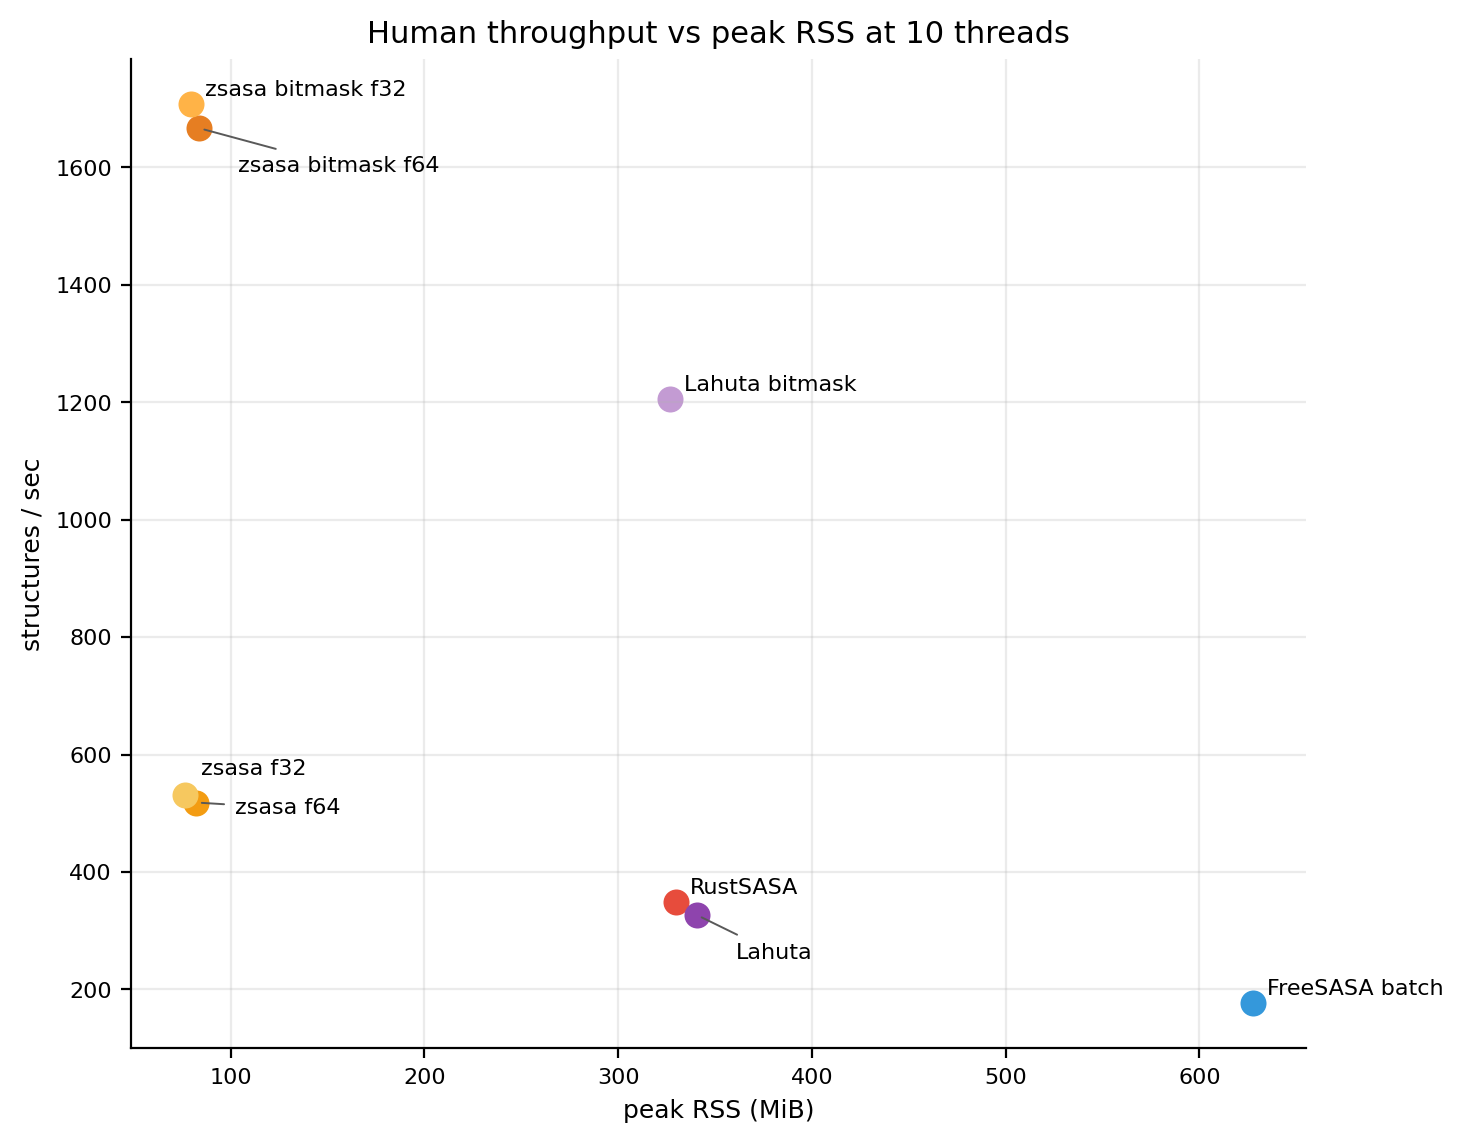
The map view is the most compact summary: points higher and farther left are better. Both datasets show the same overall pattern: zsasa bitmask modes occupy the high-throughput, low-RSS corner, while comparator runs trade more memory for lower throughput.
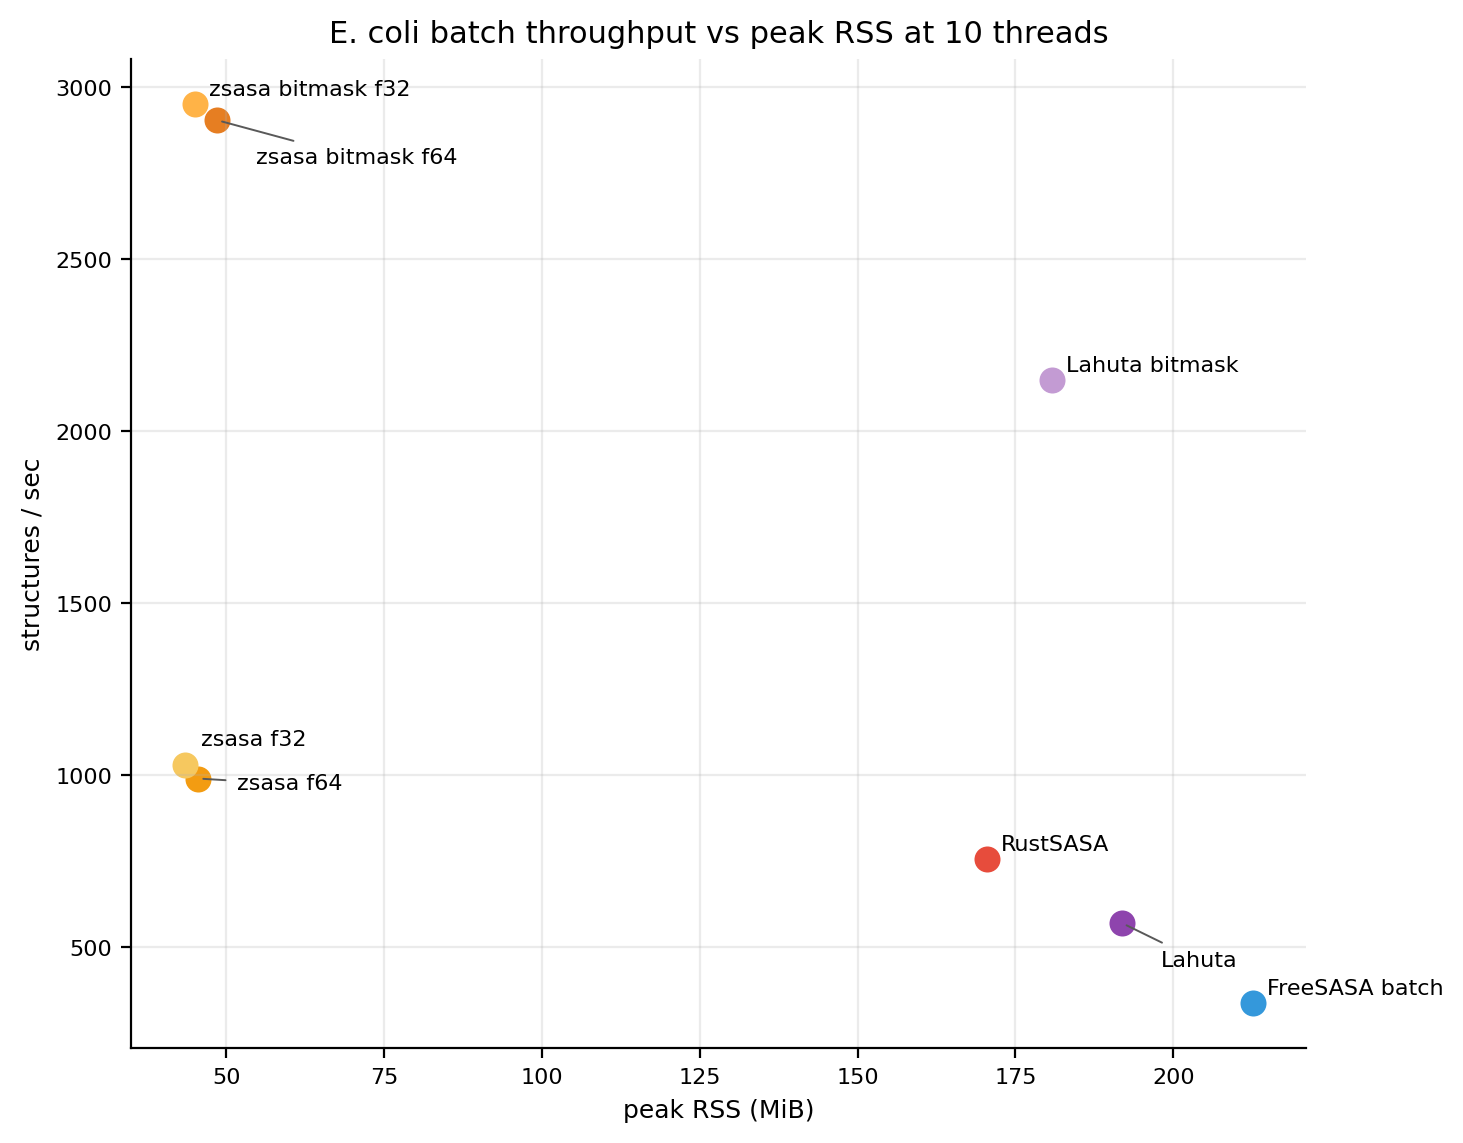
Figures 1-2. Batch throughput versus peak RSS. These figures are generated by the benchmark repository plotting script and use its label-placement rules. Click either panel to open the full-size PNG.
Headline values:
| Dataset | Structures | Best zsasa mode | Runtime | Throughput | RSS | Speedup vs FreeSASA batch |
|---|---|---|---|---|---|---|
| E. coli AFDB | 4,370 | bitmask f32 | 1.481 s | 2,951 str/s | 45.1 MiB | 8.77× |
| Human AFDB | 23,586 | bitmask f32 | 13.814 s | 1,707 str/s | 79.5 MiB | 9.70× |
E. coli AFDB batch
The E. coli AFDB collection contains 4,370 structures and is used for both comparator benchmarking and thread scaling. It is the smaller proteome-scale workload, so it is useful for seeing scheduler overhead, thread scaling, and the cost of different output modes without being dominated by disk I/O.
At 10 threads, exact zsasa f64 is already faster than the FreeSASA batch wrapper and RustSASA, while the bitmask modes move to a different throughput class. The key practical result is not only speed: peak RSS stays around 45-49 MiB for zsasa, compared with 170-213 MiB for RustSASA and FreeSASA batch in this workload.
Figure 3. E. coli throughput versus peak RSS. The bitmask modes are the fastest points and remain far left of Lahuta bitmask and FreeSASA batch on memory.
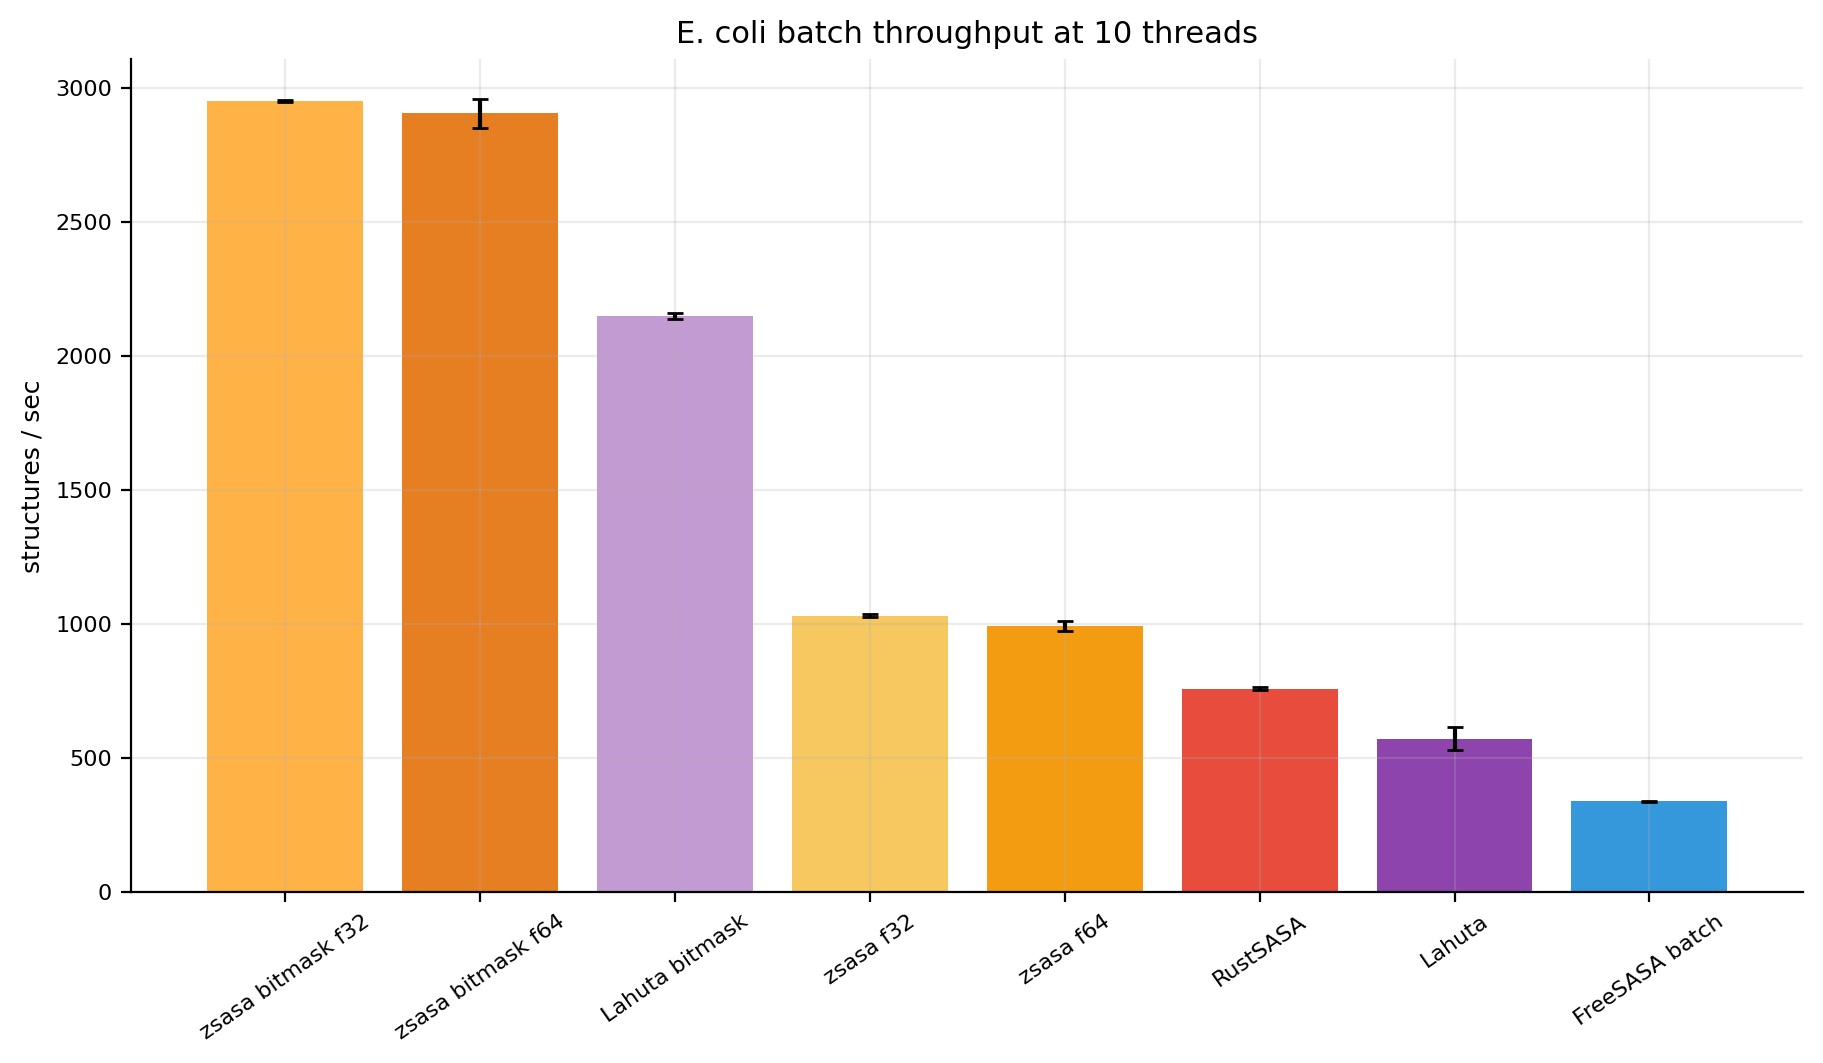
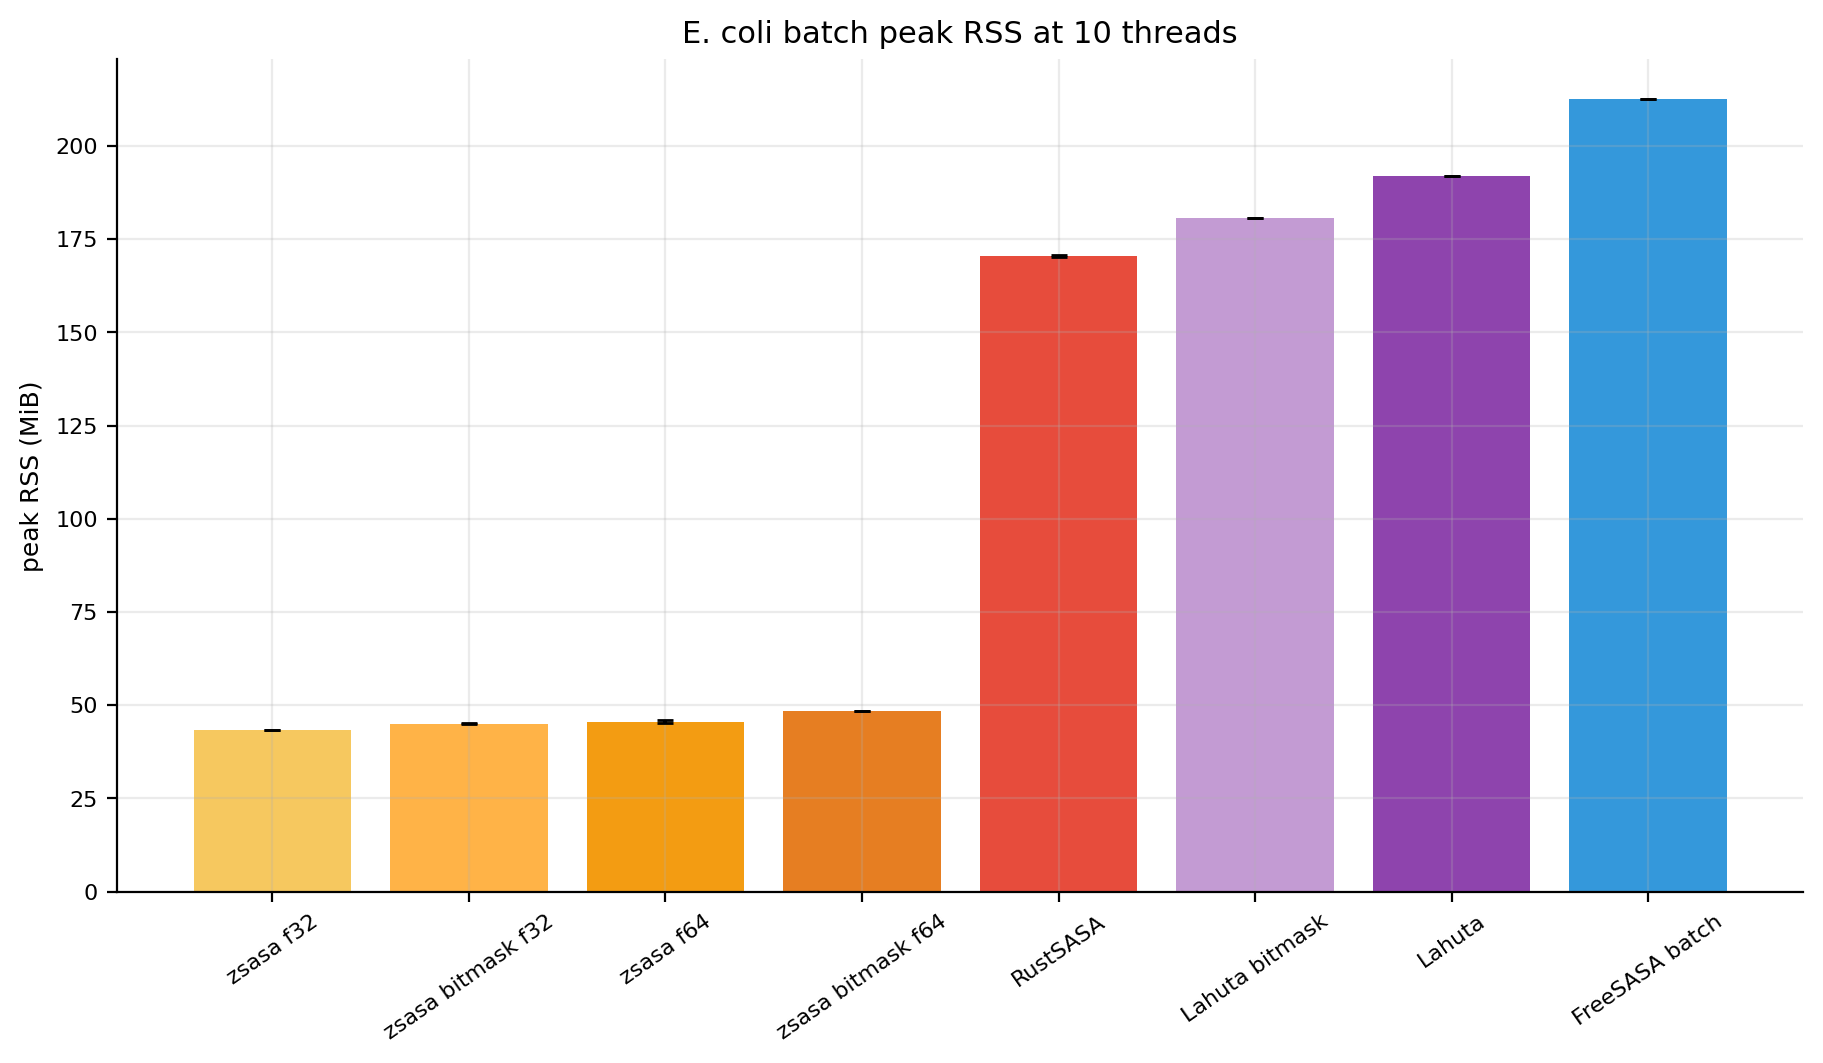
Figures 4-5. E. coli absolute throughput and peak RSS. Script-generated bar views for structures per second and memory.
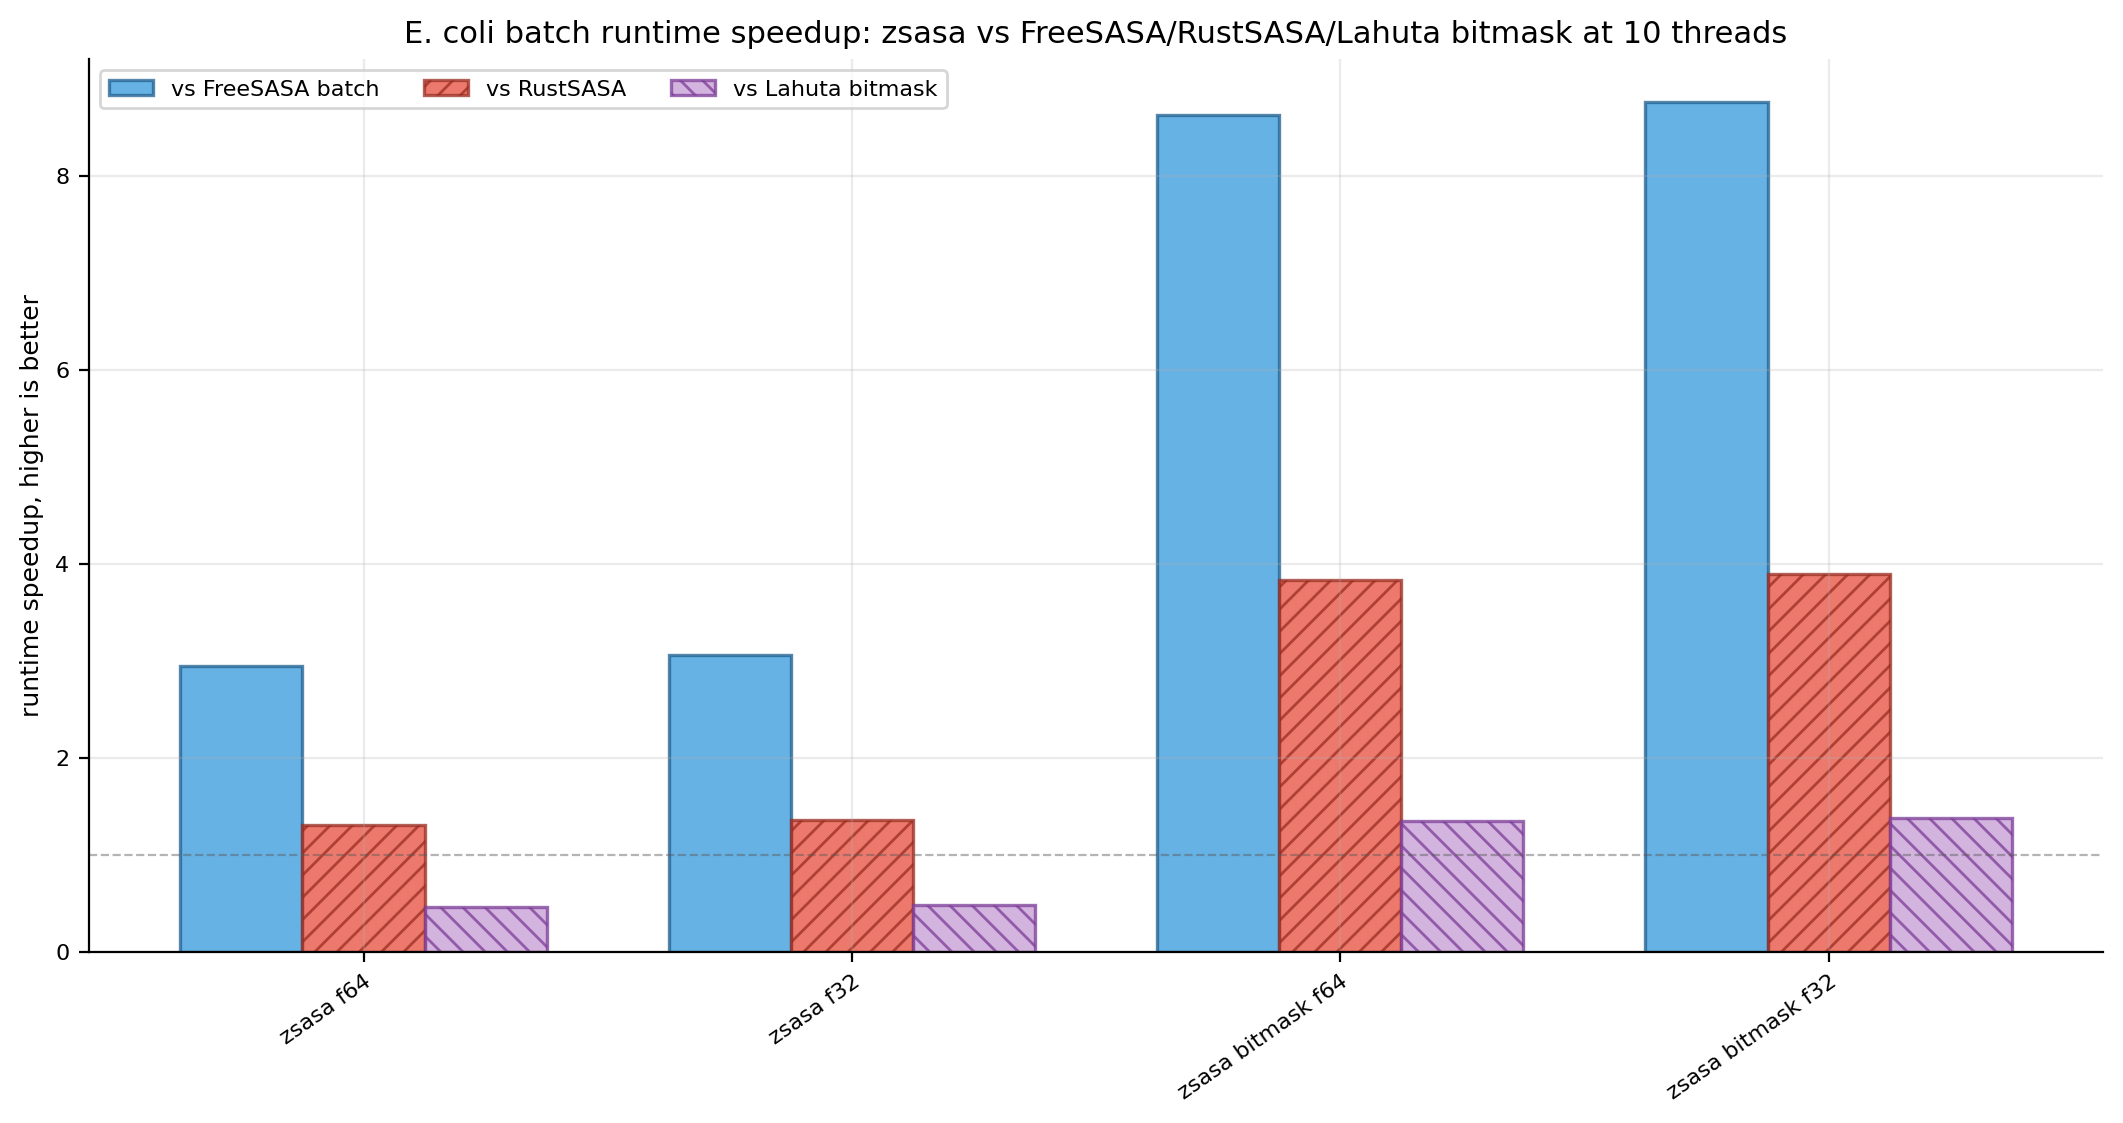
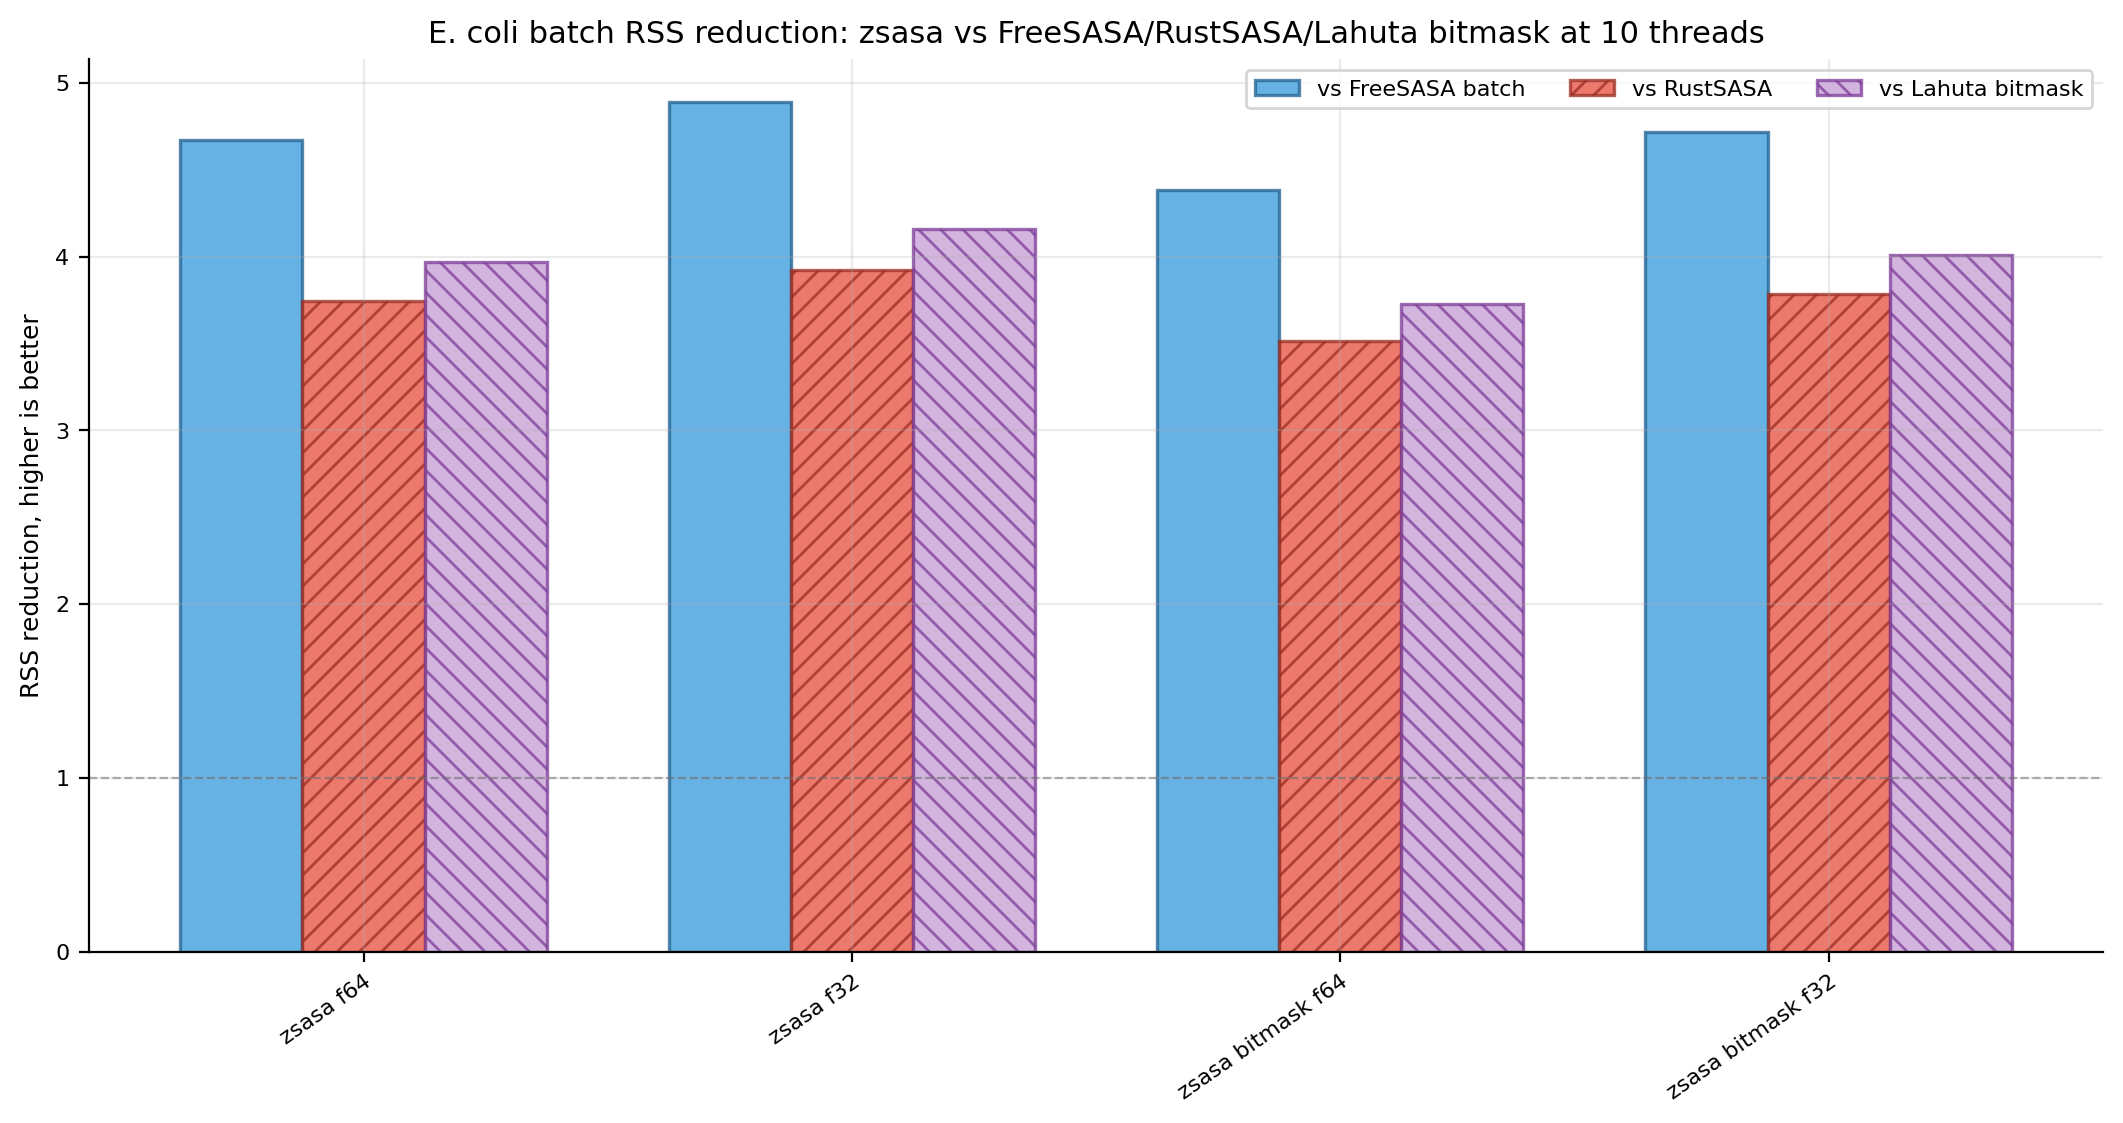
Figures 6-7. E. coli runtime speedup and RSS reduction ratios. The n× views remain useful for direct comparator comparisons.
Detailed 10-thread values:
| Tool | Runtime | Structures/s | RSS | Speedup vs FreeSASA | Speedup vs RustSASA | Speedup vs Lahuta bitmask |
|---|---|---|---|---|---|---|
zsasa f64 | 4.411 s | 991 | 45.5 MiB | 2.94× | 1.31× | 0.46× |
zsasa f32 | 4.246 s | 1,029 | 43.5 MiB | 3.06× | 1.36× | 0.48× |
zsasa bitmask f64 | 1.504 s | 2,905 | 48.5 MiB | 8.63× | 3.84× | 1.35× |
zsasa bitmask f32 | 1.481 s | 2,951 | 45.1 MiB | 8.77× | 3.90× | 1.37× |
| FreeSASA batch | 12.982 s | 337 | 212.6 MiB | baseline | 0.44× | 0.16× |
| RustSASA | 5.769 s | 757 | 170.5 MiB | 2.25× | baseline | 0.35× |
| Lahuta bitmask | 2.034 s | 2,148 | 180.7 MiB | 6.38× | 2.84× | baseline |
Thread scaling
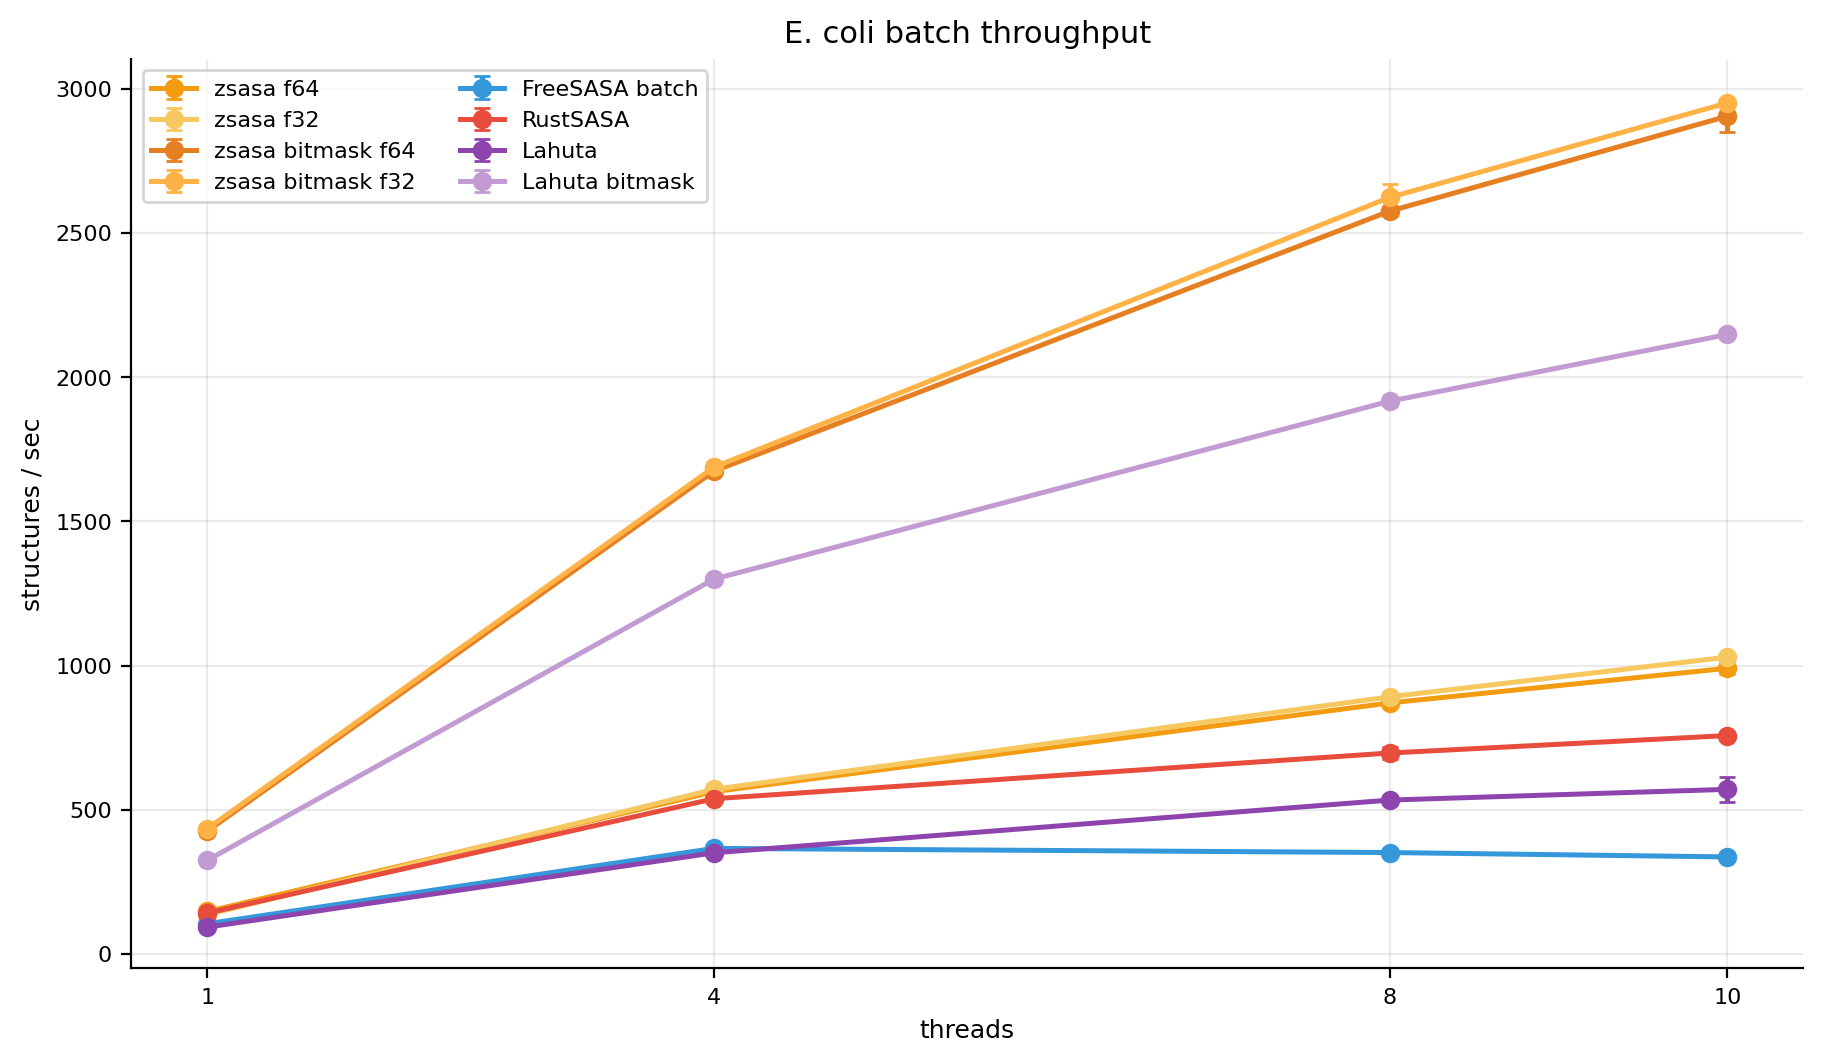
Figure 8. E. coli throughput by thread count. zsasa exact and bitmask modes scale strongly up to 10 threads on the M4 benchmark machine.
The thread-scaling plot is included because the E. coli dataset was measured at 1, 4, 8, and 10 threads. zsasa f64 reaches 6.72× speedup at 10 threads and bitmask f32 reaches 6.78×. FreeSASA batch flattens after 4 threads in this run, while RustSASA and Lahuta bitmask continue to improve but remain below the zsasa bitmask throughput at 10 threads.
Thread-scaling values:
| Mode | 1 thread | 4 threads | 8 threads | 10 threads | 10-thread speedup |
|---|---|---|---|---|---|
zsasa f64 | 147 str/s | 563 str/s | 871 str/s | 991 str/s | 6.72× |
zsasa bitmask f32 | 435 str/s | 1,688 str/s | 2,623 str/s | 2,951 str/s | 6.78× |
| FreeSASA batch | 105 str/s | 366 str/s | 352 str/s | 337 str/s | 3.21× |
| RustSASA | 142 str/s | 538 str/s | 697 str/s | 757 str/s | 5.34× |
| Lahuta bitmask | 325 str/s | 1,300 str/s | 1,917 str/s | 2,148 str/s | 6.61× |
Human AFDB batch
The Human AFDB collection contains 23,586 structures, 5.4× more than the E. coli AFDB collection. It is the main larger proteome-scale workload in the current pinned benchmark set. Human proteins are larger on average, so absolute structures/s is lower than E. coli, but the relative shape of the comparison stays the same.
zsasa retains low peak memory because batch mode streams structures instead of holding the full collection in memory. The bitmask f32 mode processes the full Human AFDB set in 13.814 s at 1,707 structures/s, while staying below 80 MiB RSS. Comparator RSS ranges from about 327 MiB for Lahuta bitmask to 628 MiB for the FreeSASA batch wrapper.
Figure 9. Human throughput versus peak RSS. The Human workload shows the same high-throughput, low-memory separation for `zsasa` bitmask modes.
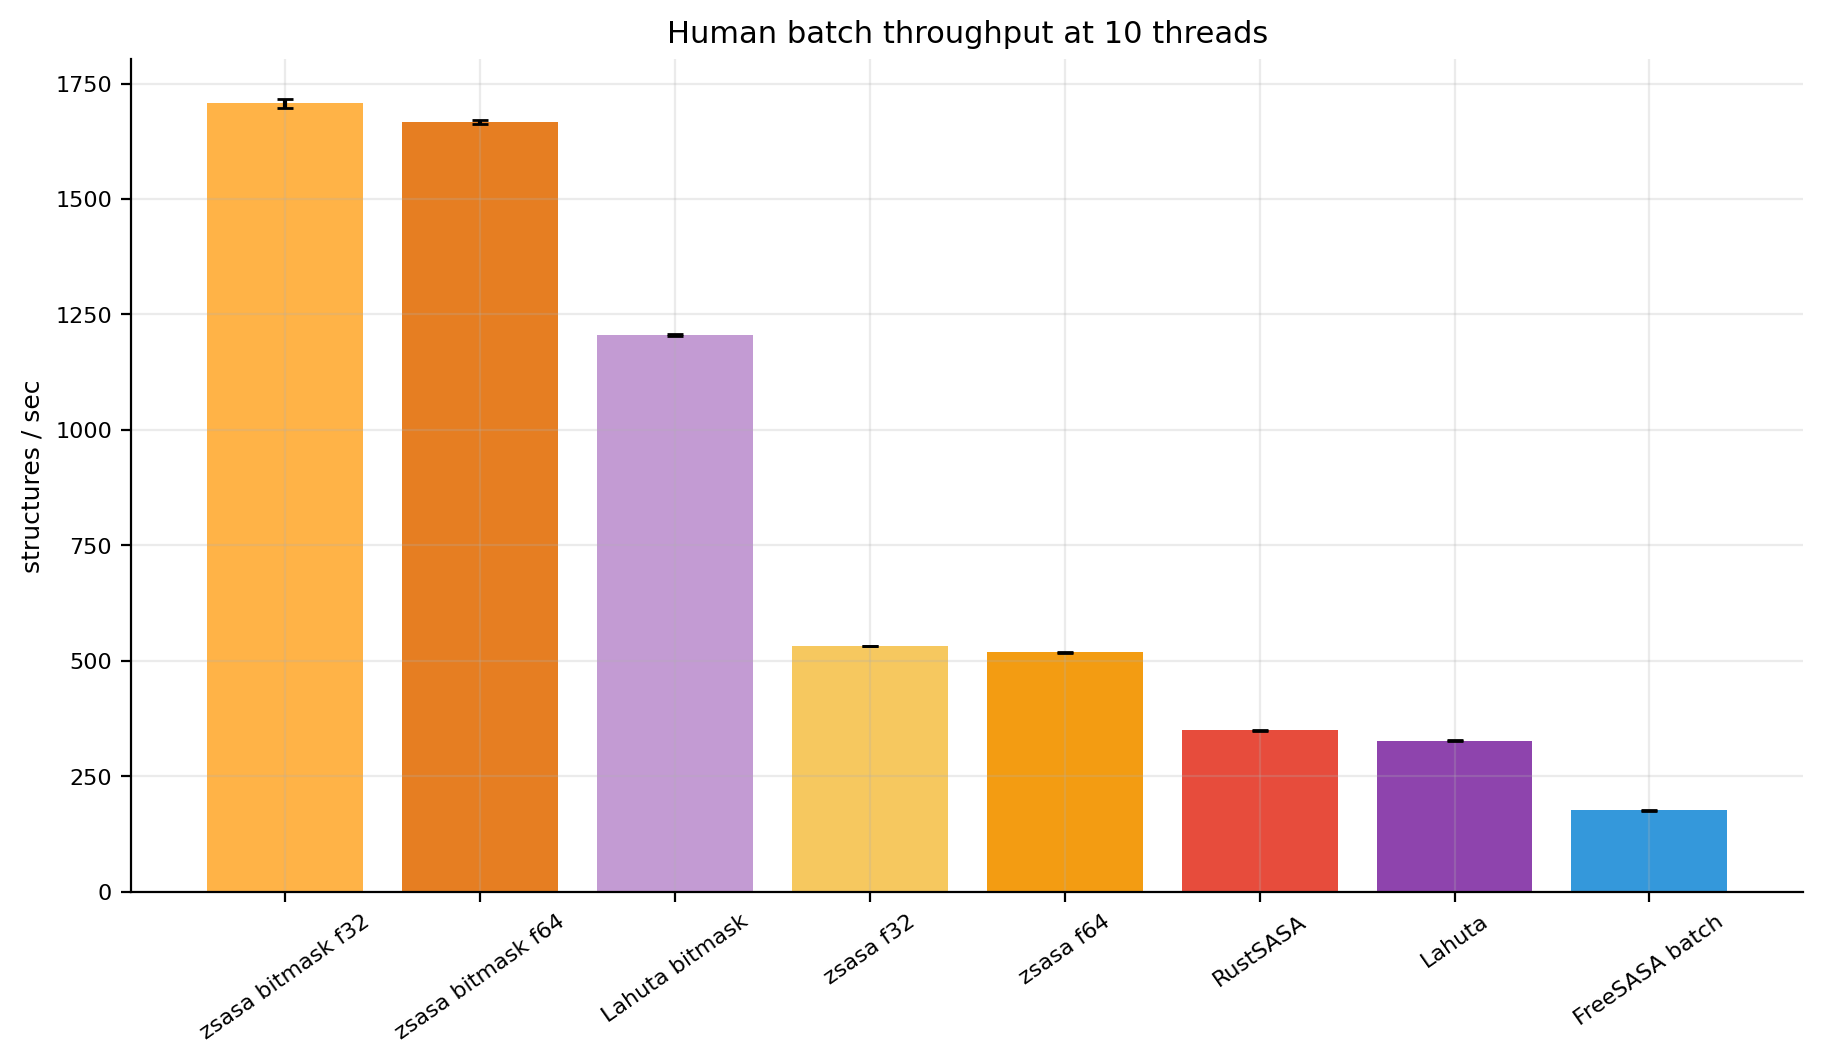
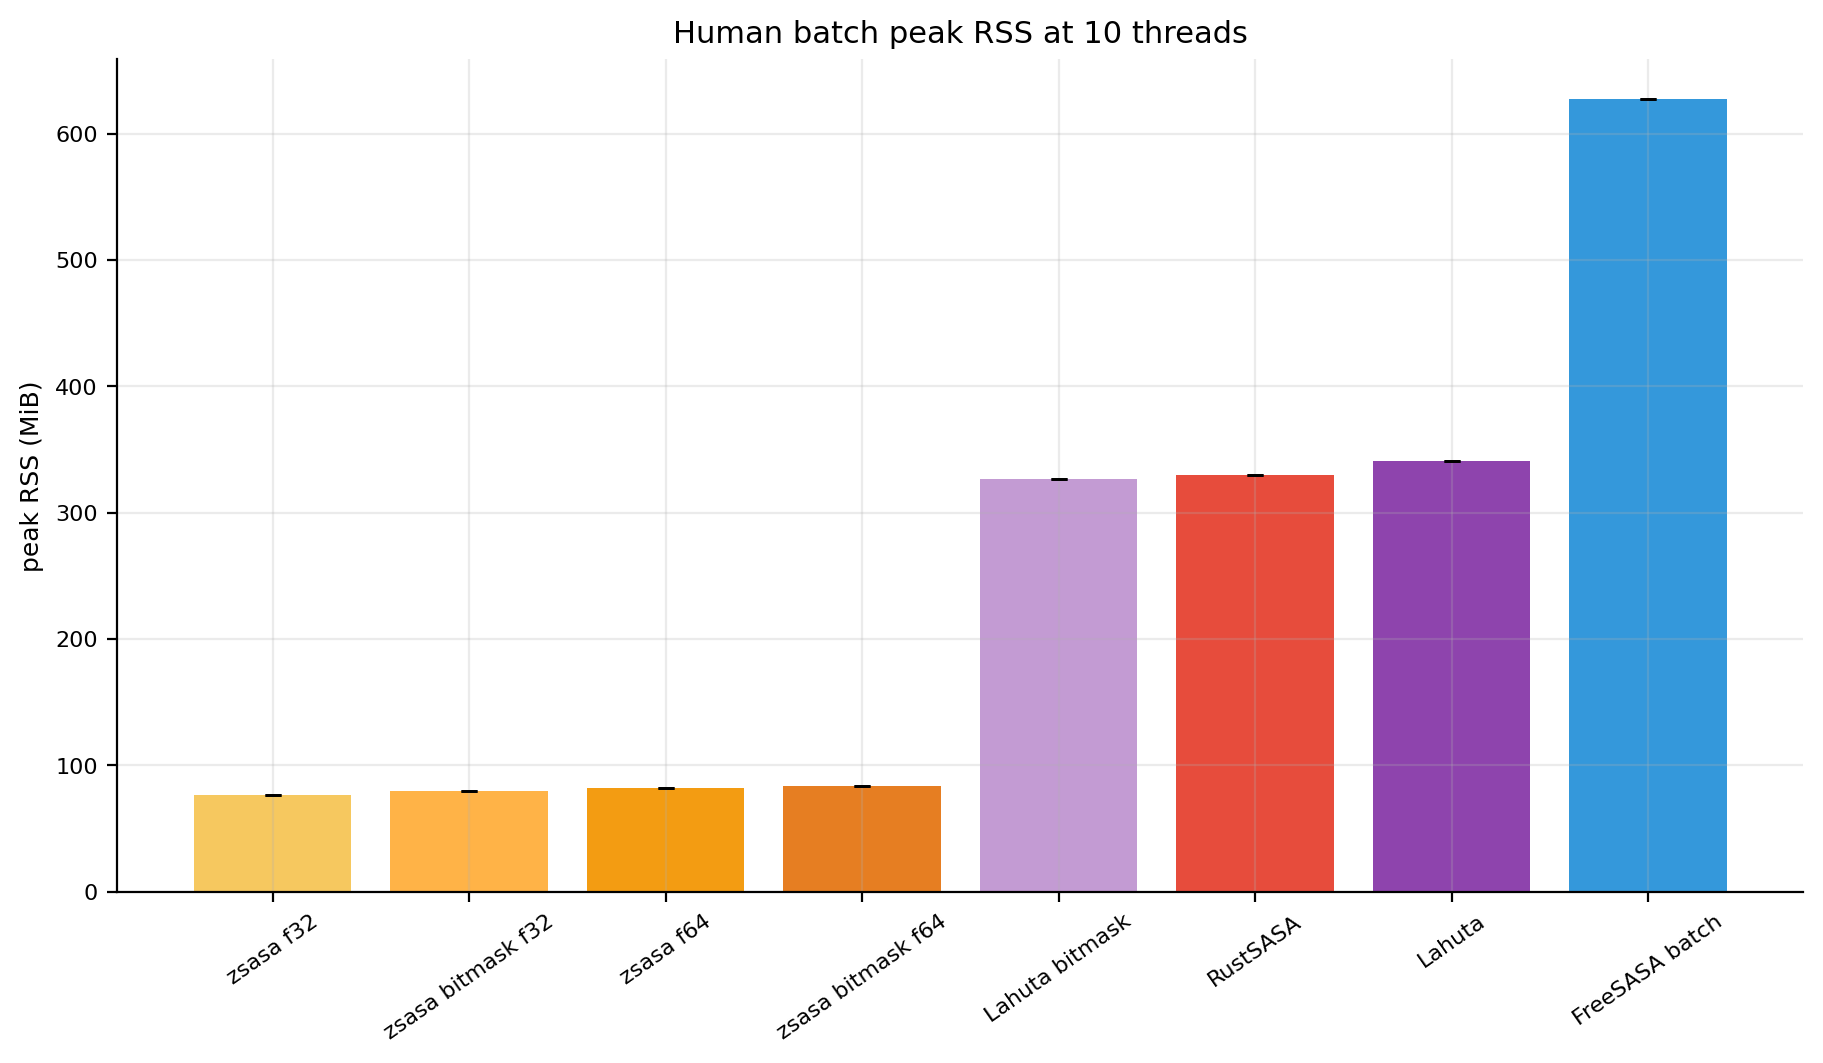
Figures 10-11. Human absolute throughput and peak RSS. Script-generated bar views for structures per second and memory.
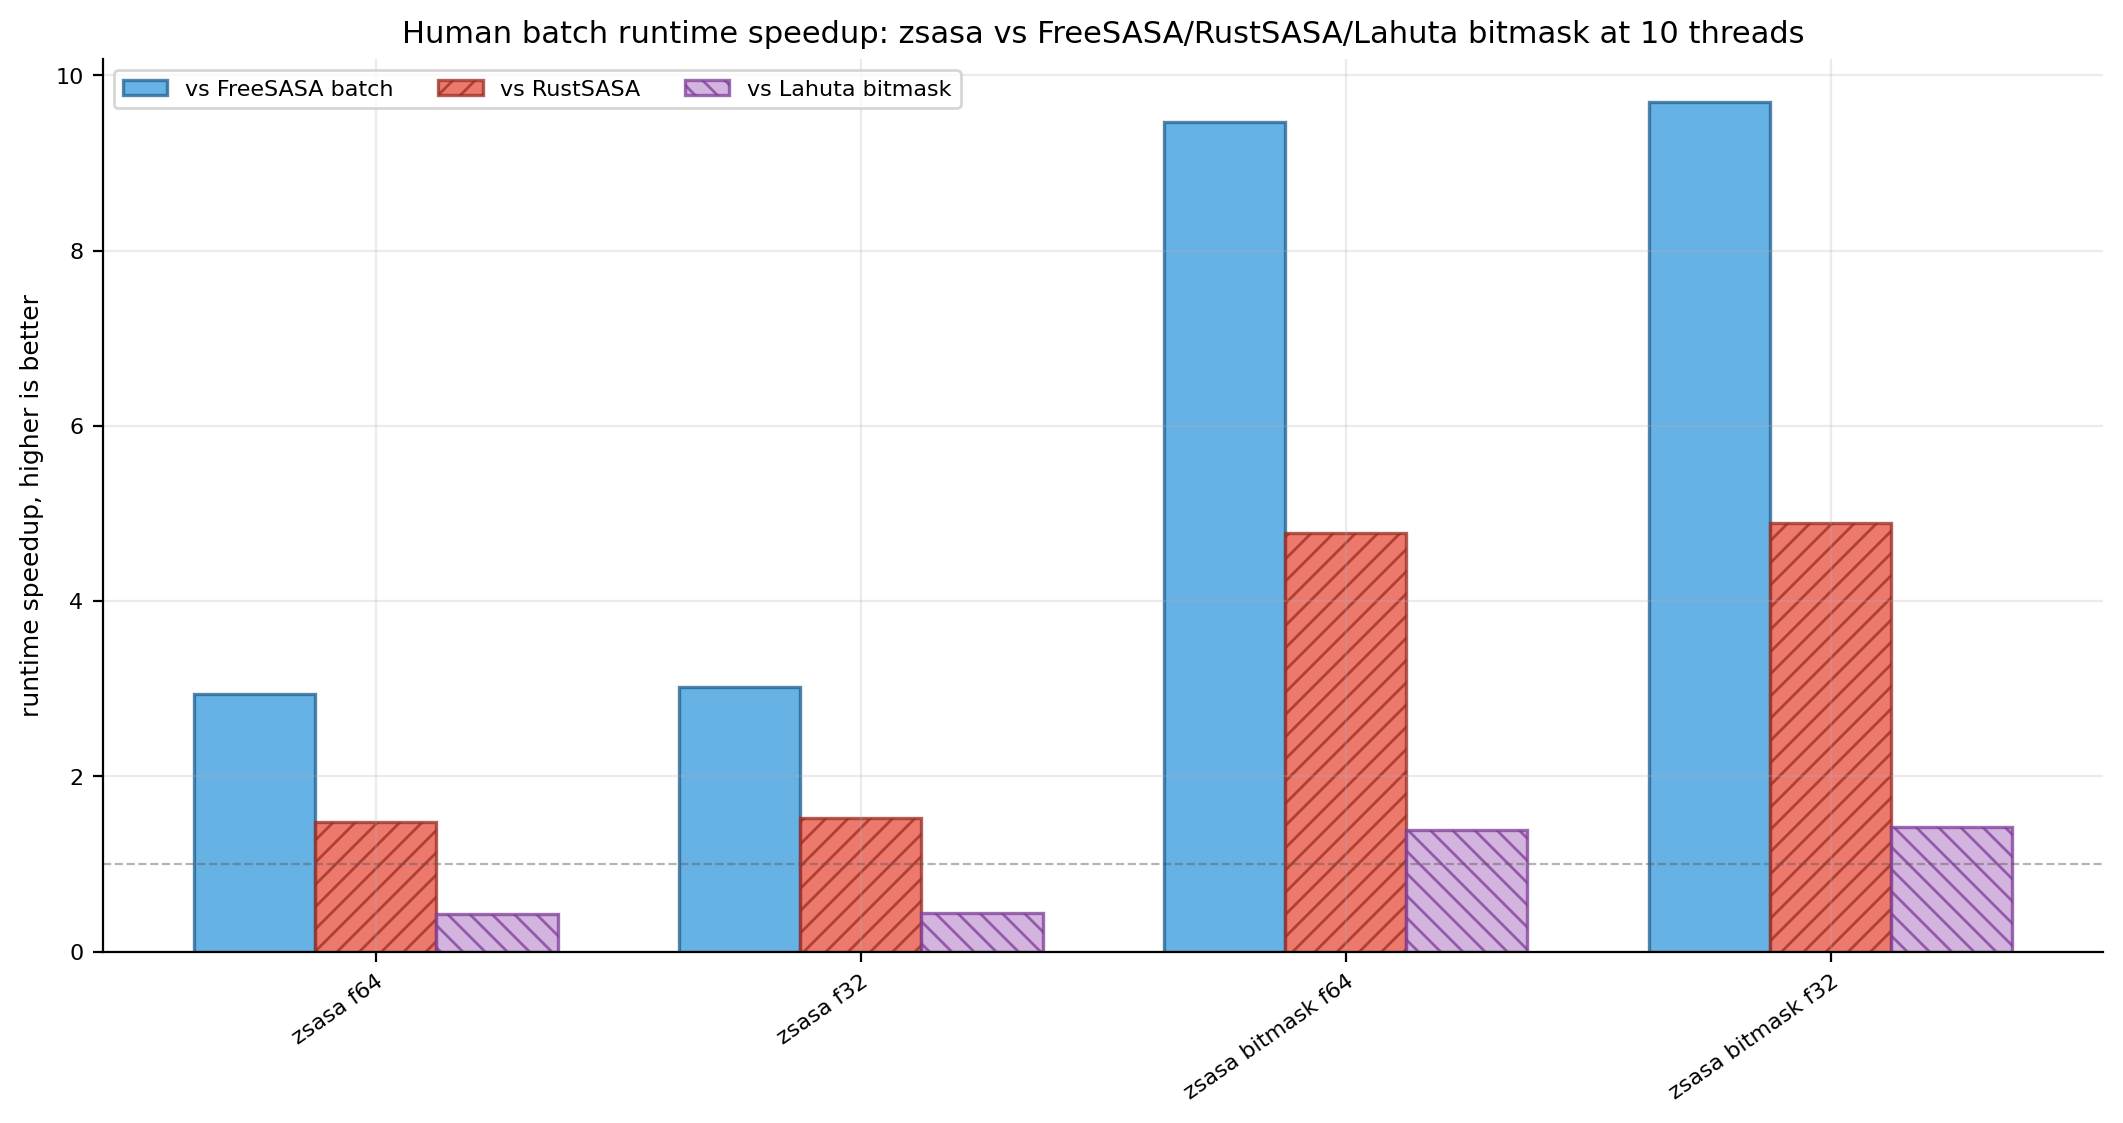
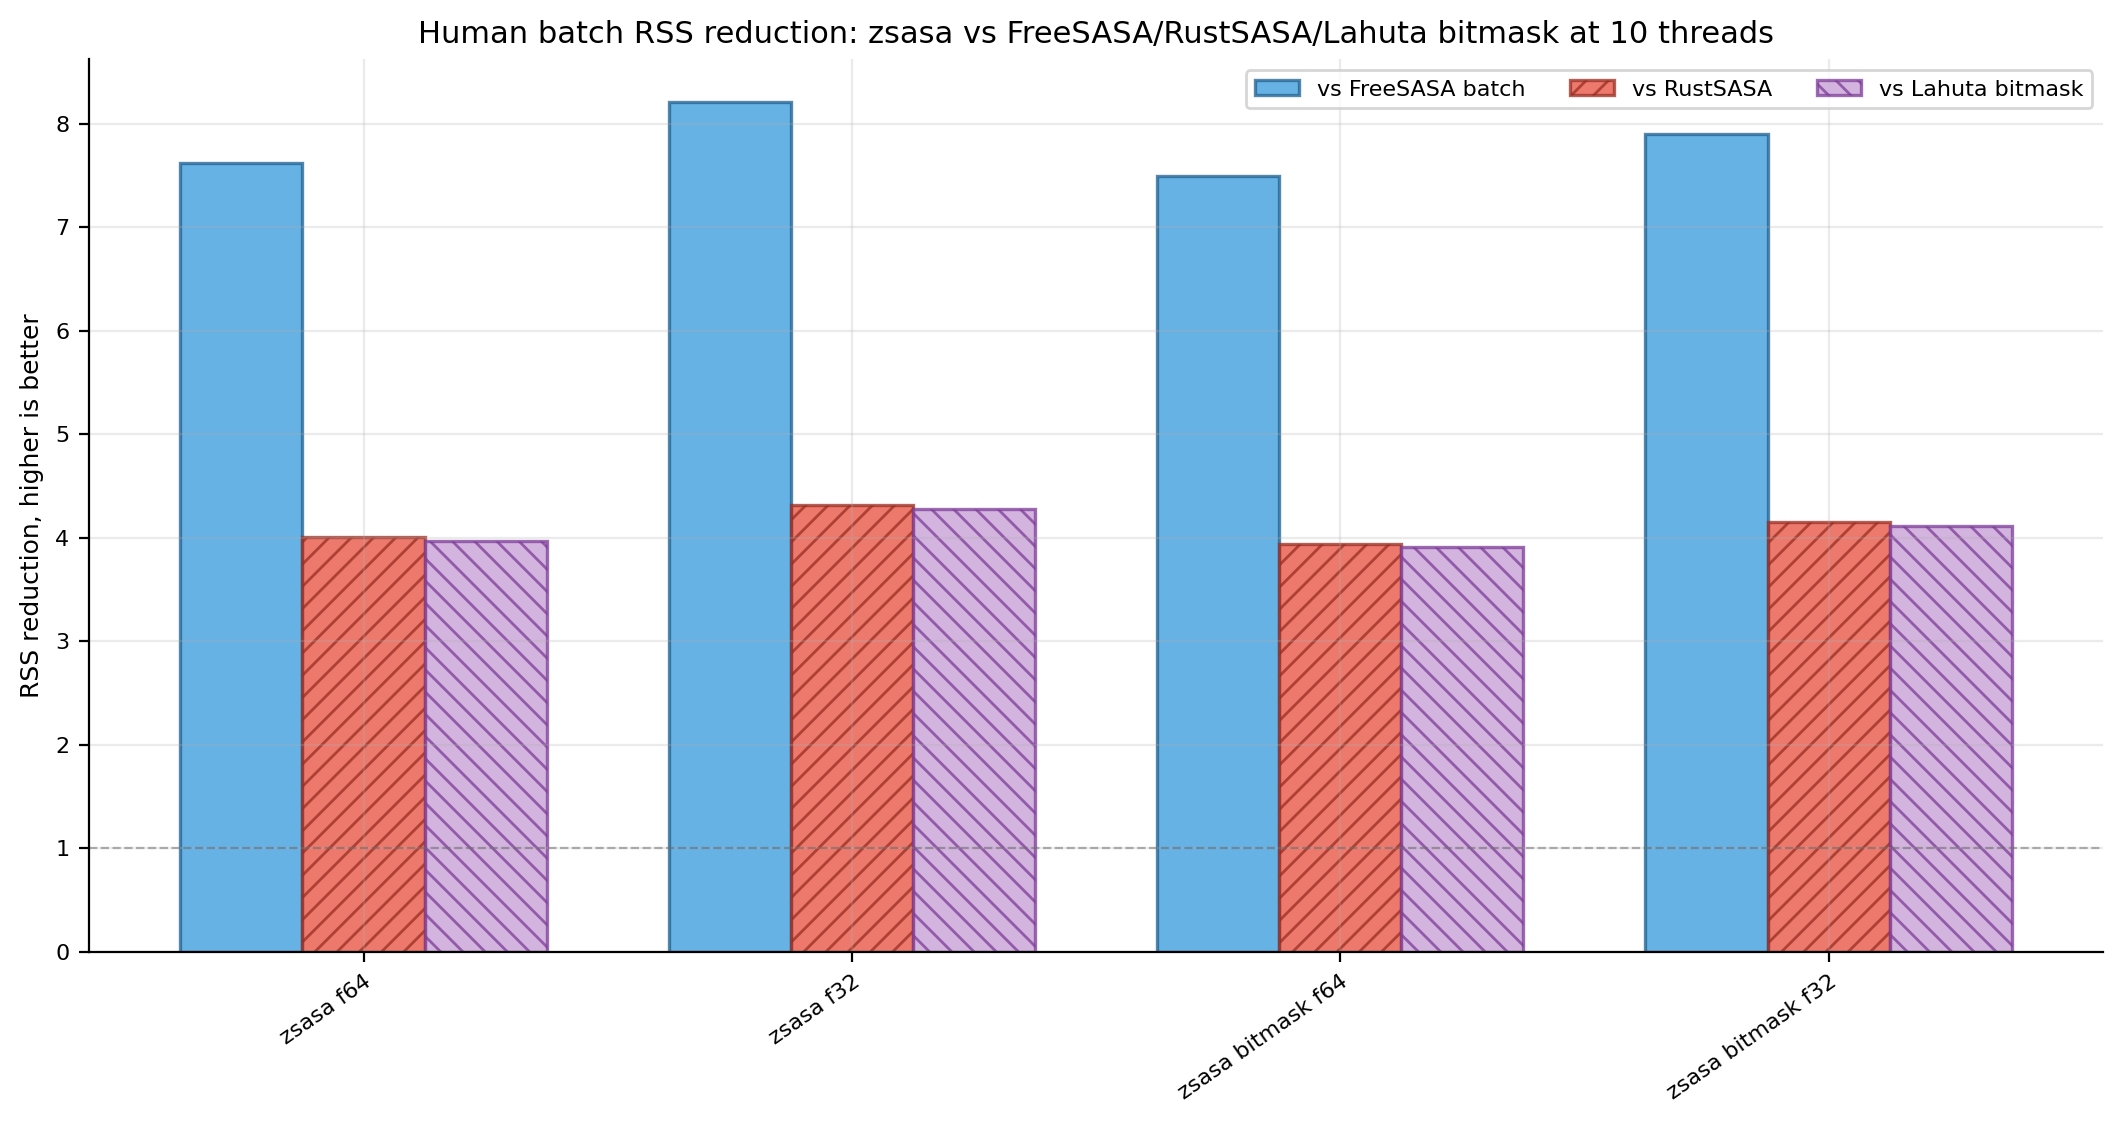
Figures 12-13. Human runtime speedup and RSS reduction ratios. Ratio views are retained alongside the absolute throughput and RSS bars.
Detailed 10-thread values:
| Tool | Runtime | Structures/s | RSS | Speedup vs FreeSASA | Speedup vs RustSASA | Speedup vs Lahuta bitmask |
|---|---|---|---|---|---|---|
zsasa f64 | 45.508 s | 518 | 82.3 MiB | 2.94× | 1.48× | 0.43× |
zsasa f32 | 44.352 s | 532 | 76.4 MiB | 3.02× | 1.52× | 0.44× |
zsasa bitmask f64 | 14.150 s | 1,667 | 83.7 MiB | 9.47× | 4.77× | 1.38× |
zsasa bitmask f32 | 13.814 s | 1,707 | 79.5 MiB | 9.70× | 4.89× | 1.42× |
| FreeSASA batch | 133.960 s | 176 | 627.5 MiB | baseline | 0.50× | 0.15× |
| RustSASA | 67.531 s | 349 | 330.0 MiB | 1.98× | baseline | 0.29× |
| Lahuta bitmask | 19.566 s | 1,205 | 326.9 MiB | 6.85× | 3.45× | baseline |
Legacy SwissProt benchmark (pre-pinned)
The SwissProt result below is retained only as historical context from the earlier website benchmark set. It was collected before the current zsasa-benchmarks pinned v0.6.0 harness and should not be mixed with the current pinned headline claims above.
It is still useful as a stress note for very large directory walks: when the dataset fits in the OS page cache, compute and per-file overhead dominate; when it exceeds memory, mmap page faults and storage behavior dominate. That is why the M2 Max and M4 results should be read separately rather than merged into the current E. coli/Human benchmark claims.
Dataset: SwissProt PDB v6, 550,122 structures, PDB format. Benchmark settings: warmup=3, runs=3, threads=10.
M2 Max, 96 GB
| Tool | Time | files/s | RSS |
|---|---|---|---|
zsasa bitmask f32 | 4m 02s | 2,269 | 157 MB |
zsasa bitmask f64 | 4m 07s | 2,229 | 162 MB |
| Lahuta bitmask | 5m 12s | 1,761 | 2,187 MB |
| RustSASA | 10m 58s | 835 | 1,131 MB |
| FreeSASA | 32m 21s | 283 | 2,875 MB |
M4, 32 GB
| Tool | Time | files/s | RSS |
|---|---|---|---|
zsasa bitmask f32 | 11m 05s | 828 | 157 MB |
zsasa bitmask f64 | 11m 07s | 824 | 161 MB |
| Lahuta bitmask | 11m 08s | 823 | 2,152 MB |
| RustSASA | 26m 16s | 349 | 1,131 MB |
| FreeSASA | 31m 42s | 289 | 2,440 MB |
On the 32 GB M4 system, the dataset exceeded available RAM and the run became I/O-bound; zsasa and Lahuta bitmask converged in wall-clock time, while zsasa retained much lower peak RSS.
Reproducing the current batch results
The current pinned benchmark data is exported from zsasa-benchmarks/results/tables/batch_t10_summary.csv and batch_thread_scaling.csv. The corresponding full harness is in N283T/zsasa-benchmarks.